- LifeStart
- Lifetime production
Key takeaways from the research:
- A LifeStart feeding schedule in Holstein dairy calves increases milk production and increases milk fat yield per day in the first and second lactation
- A LifeStart calf feeding schedule reduces the involuntary culling rate in first and second lactation
- The increase in milk production and the lower culling rate found in animals reared according to a LifeStart calf rearing programme will result in an increase in lifetime production of Holstein cows
An increase in pre-weaning growth of Holstein dairy calves results in a higher lifetime milk production
Several researchers have shown that elevated levels of pre-weaning nutrition in dairy calves have a long-lasting impact on milk production by increasing milk yield in the first[1,2,3,4,5,6,7,8,10,11] second[8,9] and third lactation[8]. The Kempenshof research programme follows two groups of Holstein dairy calves during their entire productive life. It started in 2014 and is still continuing today. Results including the first and second lactation are presented in this article.
Material and methods
Two groups of 43 Holstein dairy calves were included in the study. All calves were fed colostrum followed by cow transition milk for the first 4 days of their life, after which they were switched to calf milk replacer at a concentration of 150 g/litre according to the same protocol. Calves were weaned at 56 days of age. The calves fed according to the LifeStart calf rearing programme were fed 8 litres per day compared to 4 litres per day for the controls. From day 4 onwards all calves had ad libitum access to calf starter feed, chopped straw and water. From day 70 onwards, they were moved to group housing.
Results
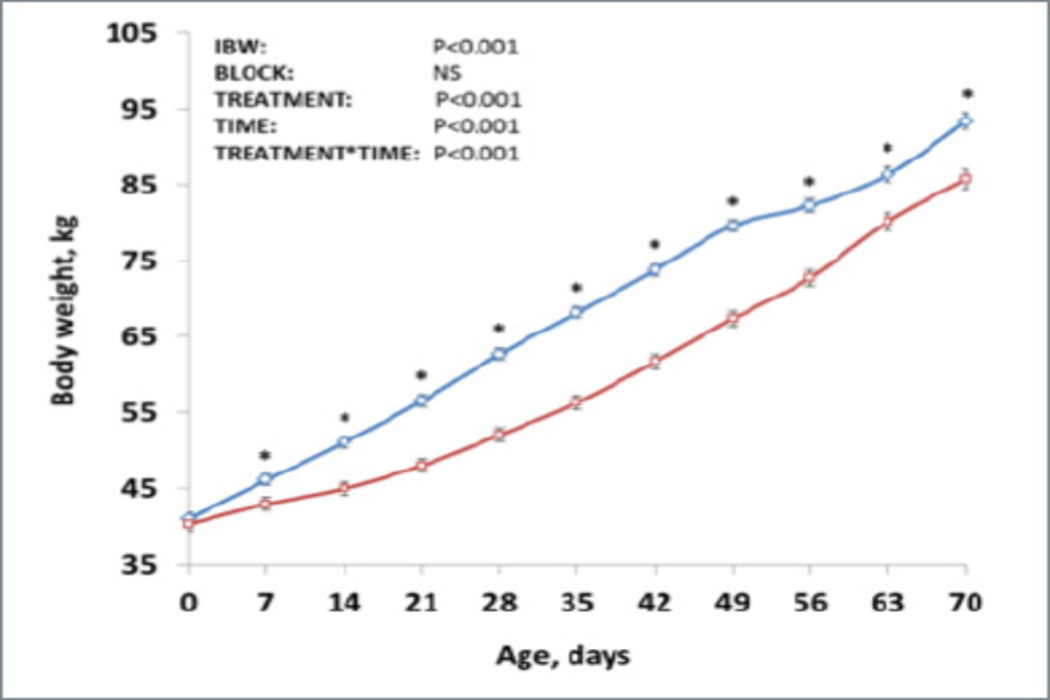
The pre-weaning average daily gain was 155 g/day higher in the calves in the LifeStart group, resulting in significantly higher body weight from day 7 onwards (see figure 1).
The LifeStart calf feeding schedule resulted in a significant increase in the production of fat corrected milk in the first lactation and in a significant increase in milk fat yield per day in the first and second lactation (see table 1).
First Lactation |
LifeStart |
Conventional |
p-value |
| Milk production (FPCM), kg/d | 30.8 | 29.9 | 0.01 |
| Fat, g/d | 1296 | 1213 | |
| Protein, g/d | 995 | 996 | 0.95 |
| Lactose, g/d | 1363 | 1368 | 0.86 |
Second Lactation |
LifeStart |
Conventional |
p-value |
| Milk production (FPCM), kg/d | 36.8 | 35.5 | 0.12 |
| Fat, g/d | 1536 | 1464 | 0.04 |
| Protein, g/d | 1208 | 1184 | 0.33 |
| Lactose, g/d | 1593 | 1545 | 0.35 |
Table 1: milk production parameters in 1st and 2nd lactation in dairy cows raised with a LifeStart feeding schedule compared to dairy cows raised with a restricted feeding schedule.
During the rearing phase, dairy calves in the group fed the conventional calf feeding schedule had a higher culling rate compared to those on a LifeStart calf feeding schedule, but this difference was small and only numerical. Culling rates in first and second lactation were however lower in the LifeStart group and by the time the animals had completed their second lactation, the difference in culling rate was substantial and had reached statistical significance, despite the fact that the total number of animals in both groups had gone down (see figure 2 and table 2).
During the rearing phase, dairy calves in the group fed the conventional calf feeding schedule had a higher culling rate compared to those on a LifeStart calf feeding schedule, but this difference was small and only numerical. Culling rates in first and second lactation were however lower in the LifeStart group and by the time the animals had completed their second lactation, the difference in culling rate was substantial and had reached statistical significance, despite the fact that the total number of animals in both groups had gone down (see figure 2 and table 2).
Figure 2: culling rates in prior to 1st calving and during 1st and 2nd lactation in animals fed according to a LifeStart feeding schedule compared to animals on a restricted feeding schedule.

First Lactation |
Conventional |
LifeStart |
Difference in number of drop-outs |
p-value |
| Number of calves weaned | 42/43 (98%) | 43/43 (100%) | 1 | 0.42 |
| Number of reaching the age of first breeding | 39/43 (90%) | 41/43 (95%) | 1 | 0.39 |
| Number of heifers that calved | 38/43 (88%) | 40/43 (93%) | 0 | 0.36 |
| Number of heifers finishing their first lactation | 28/43 (64%) | 33/43 (77%) | 3 | 0.07 |
| Number of cows finishing their second lactation | 17/43 (39%) | 24/43 (56%) | 2 | 0.05 |
Table 2: Culling rates in animals fed according to LifeStart principles compared to animals reared on a restricted feeding schedule.
Conclusion
The LifeStart calf feeding schedule resulted in a combination of an increase in milk production and a lower culling rate during first and second lactation. These differences are likely to lead to a higher lifetime production by the end of the trial and will also result in an increase in lifetime average daily milk production. This finding is in line with the results of a study by Soberon et al[8], who found differences in milk production in the first 3 lactations combined can be 1,287 or 2,280 kg higher in cows raised on elevated levels of calf nutrition, compared to those on restricted calf feeding schedules. Ultimately, a LifeStart calf rearing programme reduces the footprint per kg of milk produced, resulting in more sustainable dairy farming.
References
[1] Shamay, A., D. Werner, U. Moallem, H. Barash, and I. Bruckental. 2005. Effect of nursing management and skeletal size at weaning on puberty, skeletal growth rate, and milk production during the first lactation of dairy heifers. J. Dairy Sci. 88:1460–1469.
[2] Faber, S. N., N. E. Faber, T. C. McCauley, and R. L. Ax. 2005. Case study: Effects of colostrum ingestion on lactational performance. Prof. Anim. Sci. 21:420–425.
[3] Davis Rincker LE, VandeHaar MJ, Wolf CA, Liesman JS, Chapin LT and Weber Nielsen MS, Effect of intensified feeding of heifer calves on growth, pubertal age, calving age, milk yield, and economics. J. Dairy Sci 94:3554-3567 (2011).
[4] Moallem, U., D. Werner, H. Lehrer, M. Zachut, L. Livshitz, S. Yakoby, and A. Shamay. 2010. Long-term effects of ad libitum whole milk prior to weaning and prepubertal protein supplementation on skeletal growth rate and first-lactation milk production. J. Dairy Sci. 93:2639–2650.
[5] Raeth-Knight, M., H. Chester-Jones, S. Hayes, J. Linn, R. Larson, D. Ziegler, B. Ziegler, and N. Broadwater. 2009. Impact of conventional or intensive milk replacer programs on Holstein heifer performance through six months of age and during first lactation. J. Dairy Sci. 92:799–809.
[6] Drackley, J. K., B. C. Pollard, H. M. Dann, and J. A. Stamey. 2007. First-lactation milk production for cows fed control or intensified milk replacer programs as calves. J. Dairy Sci. 90(Suppl. 1):614 (Abstr.).
[7] Terré, M., C. Tejero, and A. Bach. 2009. Long-term effects on heifer performance of an enhanced growth feeding programme applied during the pre-weaning period. J. Dairy Res. 76:331–339.
[8] Soberon F, Raffrenato E, Everett RW and Van Amburgh ME. 2012. Preweaning milk replacer intake and effects on long-term productivity of dairy calves. J. Dairy Sci. 95:783-793.
[9] Bolt, A. 2019, Meta-analysis to calculate the effect of rearing intensity on functionality of dairy cows, Research paper Mecklenburg Vorpommern Landesforschungsanstalt für Landwirtschaft und Fischerei.
[10] Volkmann, N, Kemper, N. and A. Romer, 2019. Impacts of prepubertal rearing intensity and calf health on first-lactation yield and lifetime performance, Ann. Anim. Sci; 19: 201-214.
[11] Soberon, F and M. E. Van Amburgh, 2013, The effect of nutrient intake from milk or milk replacer of preweaned dairy calves on lactation milk yield as adults: A Meta-analysis of current data, J. Anim. Sci. 91:706-712.

